
KPI Narrative Cabinet
v0.1.0Converts raw dashboard data from Looker, Tableau, and your data warehouse into plain-English business explanations and weekly metric narratives. Keep your BI tools; replace the manual metric docs nobody reads.
KPI Narrative Cabinet
agents
Metric Analyst
.agents/analyst/
Daily Anomaly Scan
0 9 * * 1-5
Weekly KPI Narrative
0 8 * * 1
Narrative Writer
.agents/writer/
2
Agents
2
Jobs
1
Depts
4
Pages
Reads raw metric exports, runs anomaly detection, separates signal from noise, and sequences the Narrative Writer to produce the weekly KPI narrative and daily anomaly digest.
Transforms the Analyst's structured metric brief into plain-English business narratives that executives and operators can act on — no jargon, no raw numbers without meaning.
KPI Narrative Cabinet
Every Monday morning, two agents turn last week's dashboard numbers into a clear, sourced, plain-English narrative: what moved, why it moved, and what the business should do about it. Anomalies are flagged daily before anyone opens Slack. Every narrative is a file you can open, share, and archive.
Keep Looker, Tableau, Snowflake, and BigQuery. Replace the manual metric docs, the "does anyone know why DAU dropped?" threads, and the copy-paste ritual before the Monday all-hands.
The team
- [[.agents/analyst]] — Analyst. Lead orchestrator. Reads the raw metric exports, runs anomaly detection, decides what is significant vs. noise, and sequences the Writer. Owns the final narrative quality gate.
- [[.agents/writer]] — Narrative Writer. Takes the Analyst's structured findings and writes plain-English business explanations with context, comparisons, and actionable callouts — no jargon, no raw numbers without meaning.
Recurring rhythm
| Cadence | Job | Owner | Output |
|---|---|---|---|
| Weekly (Mon 08:00) | [[.jobs/weekly-kpi-narrative]] | Analyst → Writer | KPI narrative report in [[narratives/]] + dashboard updated |
| Daily (Mon–Fri 09:00) | [[.jobs/daily-anomaly-scan]] | Analyst | Anomaly log in [[narratives/anomalies.md]], dashboard flagged |
How to run the demo
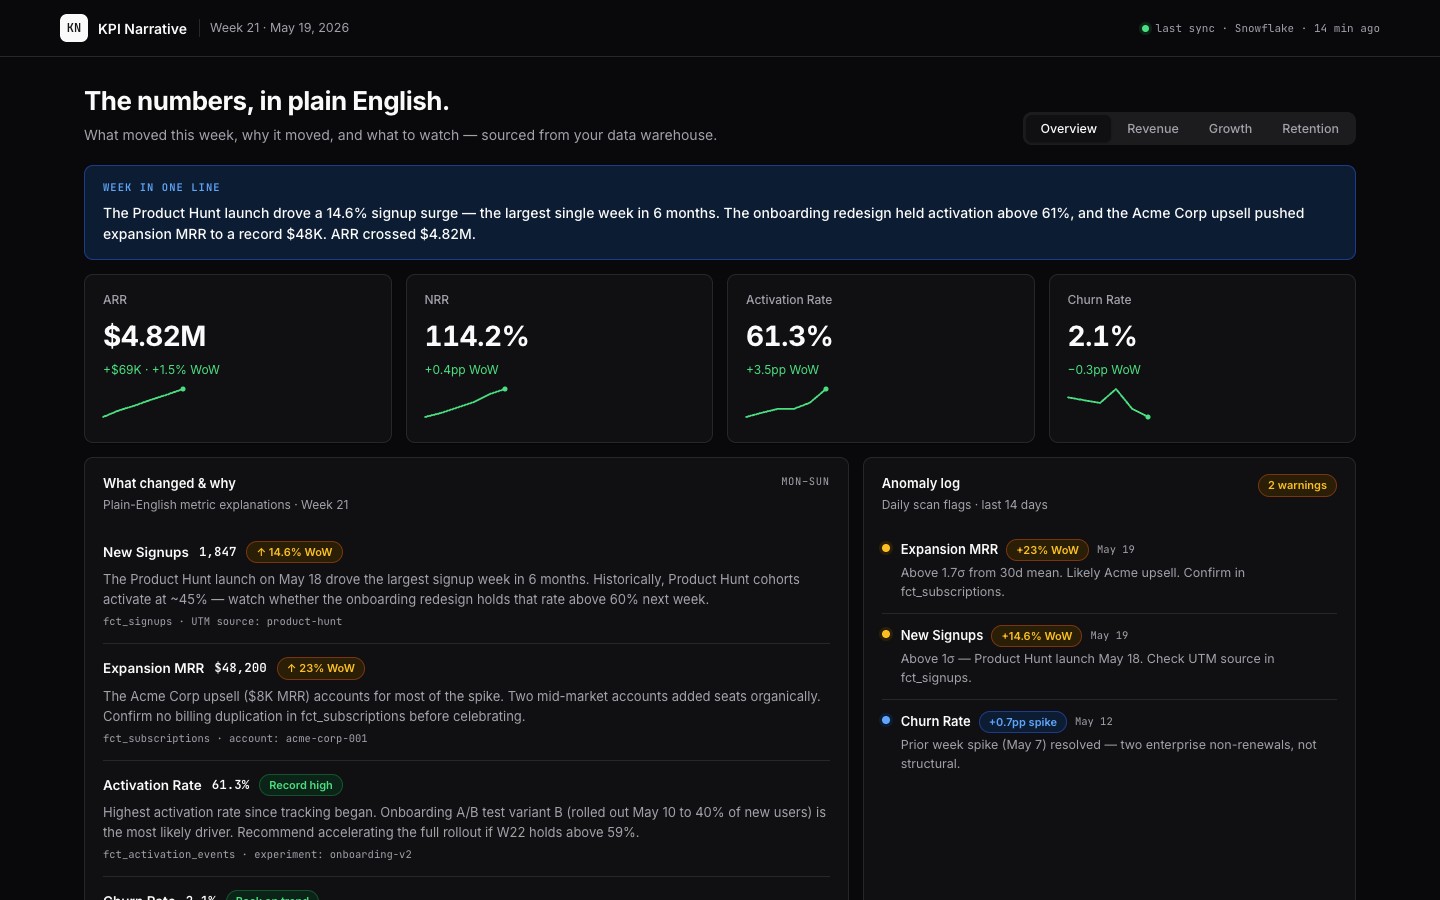
- Open the [[dashboard]] — KPI tiles with WoW deltas, SVG sparklines, plain-English "what changed & why" notes, and flagged anomalies.
- Browse [[narratives/]] — the weekly narrative reports the jobs produce, archived and diffable.
- Check [[narratives/anomalies.md]] — the rolling anomaly log from the daily scan.
- Review [[data/kpis.csv]] — the demo metric export the agents read from.
Connectors
Required: Looker, Tableau, Power BI, or Metabase (dashboard exports / API); Snowflake or BigQuery (underlying tables).
Recommended: Slack (post narrative summaries to #data or #leadership); Google Sheets (metric export target); dbt (lineage + freshness context).
Every artifact is a file. The narrative, the anomaly log, and the archived reports live as plain files in this cabinet — readable, diffable, and forwardable without a BI tool login.
$ git clone --filter=blob:none --sparse https://github.com/cabinetai/cabinets.git && cd cabinets && git sparse-checkout set kpi-narrative